Product Analytics – The Ultimate Guide for Product Managers
Product analytics involves analysing how users interact with a product to gain insights to drive product development, optimisation, and business […]
Product analytics involves analysing how users interact with a product to gain insights to drive product development, optimisation, and business strategies.
We recently conducted a session on Fundamentals of Analytics for Product Managers. This article contains the notes from the session and a further deep dive into product analytics.
Figjam board – mentor’s scribbles 🔗
Table of Contents
Why Product Analytics Matters
Product analytics is the process of measuring and analyzing how users interact with your product. It provides valuable insights into user behavior, preferences, and pain points, allowing product managers to make data-driven decisions and improve their products. Here are some key reasons why product analytics is crucial:
- Improve user experience
- Enhance business understanding
- Build influence within your organization
- Enable post-launch corrections
- Drive better product development
By mastering product analytics, product managers can create products that deliver both customer value and business value, which is the fundamental goal of product management.
Understanding Metrics and KPIs
Before diving into specific analytics techniques, it’s essential to understand the difference between metrics and Key Performance Indicators (KPIs):
- Metrics: Quantifiable data points that a business tracks and analyzes
- KPIs: Important metrics that directly relate to business success
Remember, all KPIs are metrics, but not all metrics are KPIs. As a product manager, you need to focus on the metrics that truly matter for your product and business goals.
Popular Metrics for Product Managers
Here are some essential metrics that every product manager should be familiar with:
- Revenue
- Monthly Recurring Revenue (MRR)
- Average Order Value (AOV)
- Customer Lifetime Value (CLV)
- Customer Acquisition Cost (CAC)
- Payback Period
- Retention and Churn
- Daily Active Users (DAU) and Monthly Active Users (MAU)
- Net Promoter Score (NPS)
- Conversion Rate
- Click-Through Rate (CTR)
- Average Revenue Per User (ARPU)
It’s crucial to understand that the importance of these metrics may vary depending on your product, industry, and business goals. Always consider the context when selecting and analyzing metrics.
How to Find the Right Metrics for Your Product
To determine the most relevant metrics for your product, follow these steps:
- Understand the feature: Clearly define the feature and its purpose.
- Identify why the feature was built: Determine the customer and business value it aims to deliver.
- Map the user journey: Break down the user flow into smaller steps.
- Define critical metrics: Based on the user journey, identify key metrics for each step.
- Create a metric tree: Organize metrics into a hierarchical structure, showing how they relate to each other and contribute to overall goals.
- Consider sanity metrics: Identify metrics that should not be negatively impacted by changes or improvements.
When presenting your metrics analysis, remember to summarize your findings and focus on the most important insights.
Event-Based Tracking
Event-based tracking is a powerful technique for collecting and analyzing user behavior data. Here’s how it works:
- Define events: Identify key user actions within your product.
- Implement tracking: Work with developers to implement event tracking in your product.
- Collect data: User actions trigger events, which are sent to your analytics platform.
- Analyze data: Use visualization tools to derive insights from the collected data.
Many companies use out-of-the-box solutions like Mixpanel, Amplitude, or Google Analytics to simplify the process of implementing event-based tracking.
Funnel Analysis
Funnel analysis is a technique used to understand how users progress through a series of steps in your product. It helps identify drop-off points and areas for improvement. To conduct funnel analysis:
- Identify the steps in your user flow
- Create the funnel in your analytics tool
- Analyze drop-offs between steps
- Develop hypotheses for improvements
- Implement changes and measure the impact
Remember that improving one step in the funnel may not always lead to overall improvement. Always consider the entire user journey and the impact of changes on other metrics.
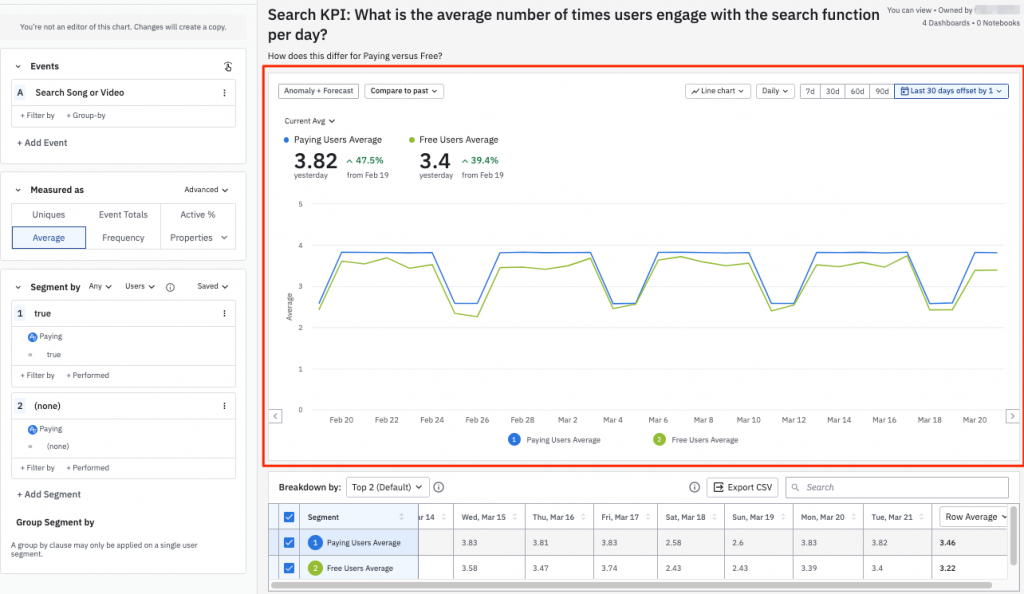
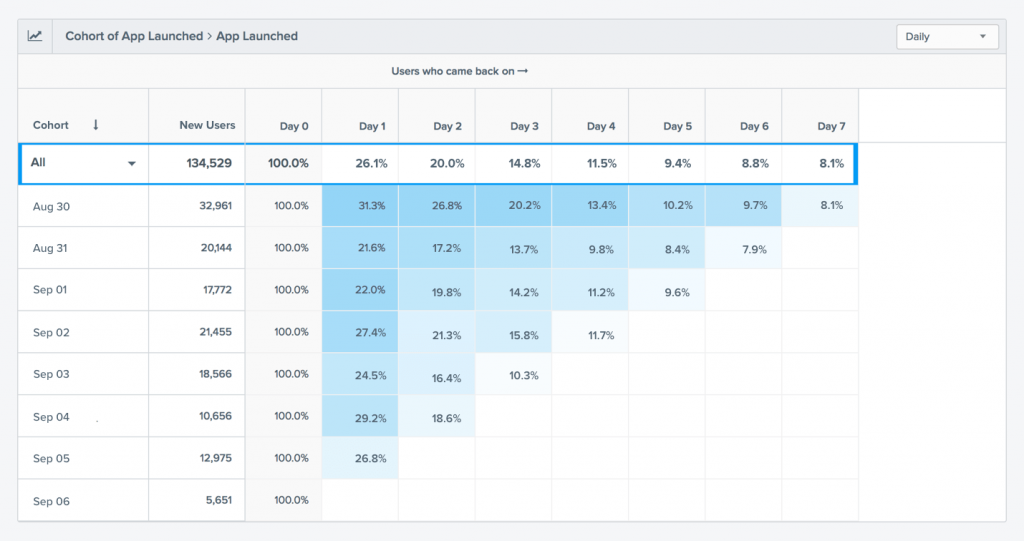
Segmentation and Cohort Analysis
Segmentation allows you to break down your user base into distinct groups based on various criteria, such as demographics, behavior, or psychographics. This helps you tailor your product and marketing efforts to specific user segments.Cohort analysis is a specific type of segmentation that groups users based on a common action or time period. It’s particularly useful for understanding user retention and how different groups of users behave over time.
Using Analytics Tools: A Quick Look at Mixpanel
To put these concepts into practice, let’s explore how to use Mixpanel, a popular analytics tool:
- Events: View and analyze individual user actions.
- Users: Explore user profiles and their activity history.
- Insights: Create visualizations and reports on specific metrics.
- Funnels: Build and analyze user conversion funnels.
- User Flows: Understand how users navigate through your product.
While Mixpanel is used as an example here, many analytics tools offer similar functionality. The key is to understand the fundamental concepts and apply them regardless of the specific tool you’re using.
Best Practices for Product Managers
To make the most of product analytics, keep these best practices in mind:
- Focus on actionable insights: Don’t get lost in data; prioritize insights that can drive meaningful improvements.
- Balance quantitative and qualitative data: Combine analytics with user research and feedback for a complete picture.
- Continuously iterate: Use analytics to inform product decisions, then measure the impact of those changes.
- Collaborate with other teams: Work closely with developers, designers, and marketers to implement and act on analytics insights.
- Stay curious: Always question your assumptions and look for new ways to analyze and understand your product’s performance.
Hence, Product analytics is a powerful tool for product managers to drive data-informed decisions and create successful products.
By understanding key metrics, implementing event-based tracking, and leveraging analytics tools, you can gain valuable insights into user behavior and product performance.
Remember that analytics is just one piece of the product management puzzle. Combine your analytical skills with user empathy, problem-solving abilities, and effective communication to become a well-rounded and successful product manager.
To continue developing your product analytics skills, practice creating metric trees for various products, experiment with different analytics tools, and stay up-to-date with the latest trends and techniques in the field. With dedication and continuous learning, you’ll be well-equipped to tackle the challenges of product management in today’s data-driven world.
Here is a more detailed commentary on the product analytics, not covered in the session structure completely, along with a few more cases 👇🏽
Product analytics is fundamentally about using data gathered from user interactions with the product—such as clicks, usage time, feature adoption, and customer journey paths—to inform decisions about product features, identify potential improvements, and measure overall product performance.
In this comprehensive guide we will cover the following aspects of Product Analytics
- User Metrics – Important Metrics for Product Managers to track at different stages in a Product life cycle
- User Behavior Tracking: Monitoring interactions with a product to identify what features work well and which do not.
- Segmentation: Analyzing user behavior by specific groups to tailor product improvements to diverse needs.
- Conversion Funnel Analysis: Studying the user steps towards a goal to find and reduce drop-off points, enhancing conversion rates.
- Retention Analysis: Determining what keeps users engaged with a product over time to enhance retention strategies.
- Feature Testing: Employing A/B or multivariate testing to compare different versions of a feature to optimize user satisfaction.
- Predictive Analytics: Using past data to forecast future user behaviors, aiding in proactive product and engagement planning.
- Product Analytics Tools: Software solutions like Amplitude, Mixpanel, and Google Analytics that facilitate the collection and analysis of product data.
Some of the most asked Product Analytics Questions in Product Management Interviews
- How would you measure the success of YouTube?
- What is the most important metric for Slack and why?
- What is the most important metric for Uber Eats? Why?
- How would you evaluate the success of Instagram Stories?
- How would you measure the success of Google Photos?
- You’re the PM for Meta (Facebook) Pay. What goals would you define, and what metrics would you track to measure your team’s success?
- How would you measure the success of stripe check out page?
- You’re a PM at Meta, launching a new feature for audio-only posts for stories. What metrics would you measure?
- Choose a Fintech product and discuss its business objectives and key performance indicators (KPIs).
Most important Product Metrics to track as a Product Manager
Most of us confuse between Metrics, KPIs and OKRs but they are actually not the same
- Metrics: These are numerical measurements that track various aspects of business performance.
Example: A metric could be the “Number of downloads” for a mobile app, which simply tracks how many times the app has been downloaded.
- KPIs (Key Performance Indicators): These are critical indicators chosen specifically to assess how effectively the business is achieving key objectives.
Example: A KPI could be the “Conversion Rate,” which measures the percentage of visitors to your website who make a purchase. This KPI is vital for an e-commerce business because it directly relates to generating revenue.
- OKRs (Objectives and Key Results): This framework involves setting a clear objective and defining measurable key results to track the achievement of that objective.
Example:
Objective: Improve customer support.
Key Results:
- Reduce average response time to customer queries by 50% within the next quarter.
- Achieve a customer satisfaction score of at least 90% in post-support surveys.
| Category | Metrics | Definition |
| Acquisition | Total number of new users | Counts all new users who start using your product within a specific time period. |
| Acquisition channels | Tracks the sources through which users find and start using your product, like social media or ads. | |
| Cost per acquisition (CPA) | The average cost spent to acquire one new user through marketing efforts. | |
| Conversion rates | Measures the percentage of visitors who perform a desired action like signing up. | |
| Customer Acquisition Cost (CAC) | The total cost of acquiring a new customer, including all marketing expenses. | |
| CAC by source | Breaks down the acquisition cost by marketing channel to see which is most efficient. | |
| Activation/Onboarding | Activation rate | The percentage of new users who take an action showing they find value in your product. |
| Time to value (TTV) | The time it takes for a new user to reach a key benefit from your product. | |
| Feature adoption rate | The rate at which users start using a new feature of your product. | |
| Onboarding Completion Rate by Cohort | The percentage of users in a specific group who complete the onboarding process. | |
| User Activation Rate by Segment | Measures how many users in a specific group reach a critical early milestone in the product. | |
| Engagement | MAU and DAU | Monthly Active Users and Daily Active Users |
| Session duration and frequency | The average length and number of times users interact with your product. | |
| Feature usage and interaction | Tracks specific actions users take with features in your product. | |
| Feature Adoption Rates | Percentage of users using a new feature within a set time after its release. | |
| Stickiness Ratio (DAU/MAU ratio) | Indicates how often users return to your product within a month. | |
| Feature Fit Index (FFI) | The percentage of users who would miss a feature if it were removed. | |
| Retention | Retention rate | The percentage of users who continue to use the product over a certain period. |
| Churn rate | The percentage of users who stop using the product over a specified time. | |
| Cohort Retention | Tracks how long specific groups of users continue using the product. | |
| First-Week Churn Rate by Cohort | Measures how many new users stop using the product within the first week. | |
| Revenue/Conversion | MRR and ARR | The total predictable revenue from all subscriptions on a monthly and annual basis. |
| ARPU | The average revenue generated from each user during a specific period. | |
| Conversion rate | The percentage of users who convert from free to paid or complete another desired action. | |
| Reactivation MRR | Revenue from customers who previously churned but have returned. | |
| Conversion Rate by Source | Measures the effectiveness of different marketing sources in achieving user conversions. | |
| Customer lifetime value (CLTV) | The total revenue expected from a customer throughout their relationship with your product. | |
| Referral | Referral Rate | The percentage of users who recommend your product to others. |
| Customer Satisfaction | Net Promoter Score (NPS) | Measures how likely customers are to recommend your product to others. |
| Customer Satisfaction Score (CSAT) | A direct score from customers rating their satisfaction with your product or service. | |
| Number of Support Tickets | The volume of customer support tickets raised, indicating potential issues needing attention. |
User Behavior Tracking
User behavior refers to all the actions that users take while interacting with a product, such as clicking, scrolling, or navigating through different parts. By observing these actions, you can understand what attracts or confuses users, and how to make their experience better.
Example: If you notice that many users click on a promotional banner but then quickly leave the checkout page, you might conclude that the checkout process is too complicated or unclear, prompting you to simplify it to boost sales.
Google Analytics: Tracks basic interactions and provides insights into user behaviour trends.

Mixpanel: Offers detailed event tracking to understand user interactions on a granular level.
Benefits of Tracking User Behavior
- Improve Product Experience: By understanding how users interact with your product, you can identify and fix issues, enhance usability, and make the experience smoother and more engaging.
- Data-Driven Decisions: Tracking user behavior allows you to make informed decisions based on real user interactions rather than assumptions. This leads to better product development and marketing strategies.
- Increase User Retention and Conversion: By analyzing how users engage with your product, you can identify what keeps them coming back or what drives them away, helping you to improve retention rates and conversion.
How to track user behavior?
- Web Analytics Tools: Use platforms like Google Analytics to collect data on how users interact with your website—what pages they visit, how long they stay, and what actions they take.
- Heatmaps: Tools like Hotjar or Crazy Egg create visual representations of where users click, scroll, and move on your site. This helps identify hot spots of activity and areas that may be confusing or overlooked.
- Session Recordings: Capture real-time video of user sessions to observe exactly how users navigate through your product. This provides a direct view into their experience and any issues they encounter.
- Event Tracking: Set up tracking for specific actions within your application, such as button clicks or form submissions. Tools like Mixpanel or Amplitude can help track these events to see how users engage with specific features.
- Surveys and Feedback: Directly ask users about their experience using on-site surveys or feedback forms. This can provide qualitative insights into user satisfaction and areas for improvement.
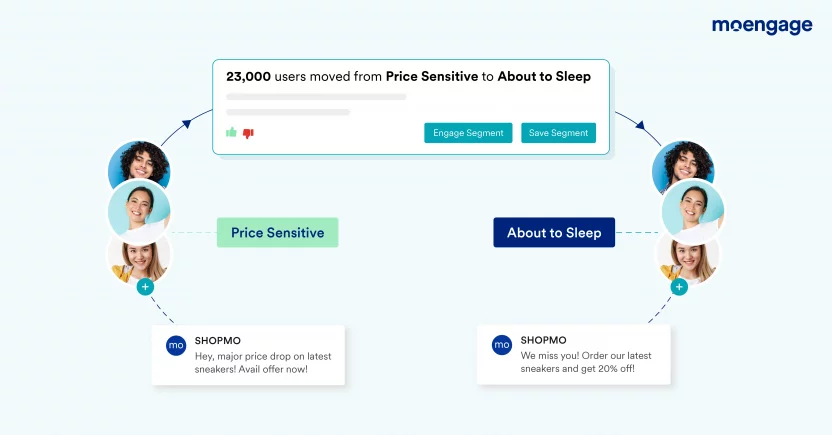
Segmentation
User segmentation in product analytics is grouping users based on their demographics or behaviour to establish a baseline for analysis.
MoEngage and CleverTap: Enables segmentation based on user behaviour, engagement, and demographics.
Amplitude: Provides behavioural segmentation for creating targeted strategies.
Benefits of User Segmentation
- Understand Different Needs: Different users might use your product for various reasons. By grouping users into segments based on similarities like age, location, or behavior, you can better understand what each group needs or prefers.
- Personalize Experiences: When you know which segment a user belongs to, you can tailor the product experience to their specific needs or interests. This personal touch can make the user feel valued and improve their satisfaction.
- Effective Marketing: Segmentation allows you to target your marketing efforts more precisely. For example, you might send different promotional emails to new users than to those who have been using your product for years.
- Identify Growth Opportunities: By analyzing how different segments use your product, you can identify which features are popular and where there might be opportunities to introduce new features or improvements.
- Better Product Decisions: Segmentation helps you make informed decisions about where to allocate resources. For instance, if one segment of users is very profitable, you might decide to focus more on enhancing features that are important to them.
How to do User Segmentation?
- Create User Personas: Begin by defining the main user personas, which represent your typical user groups.
- Collect Customer Data: Use tools to gather essential data for segmentation. Ensure the questions are relevant and provide value, as this can enhance user cooperation and give you better insights.
- Decide on Your Segmentation Model: Choose a segmentation model based on your objectives, such as improving customer satisfaction or increasing usage of specific features. You may use multiple models like demographic, behavioral, and psychographic segmentation simultaneously to address different goals.
- Track User Behavior Among Different Segments: With your segments defined, continuously collect and analyze data on how different segments interact with your product.
- Create Strategies for Different User Segments: Based on the behavior analysis, develop targeted strategies for each segment to improve the metrics you are focusing on.
- Measure the Impact of Those Strategies: Implement your strategies and monitor their effectiveness through key metrics and trends. Use visualizations and dashboards to track these metrics across different segments. Iterate and refine your strategies based on the data to ensure they effectively achieve your desired outcomes.
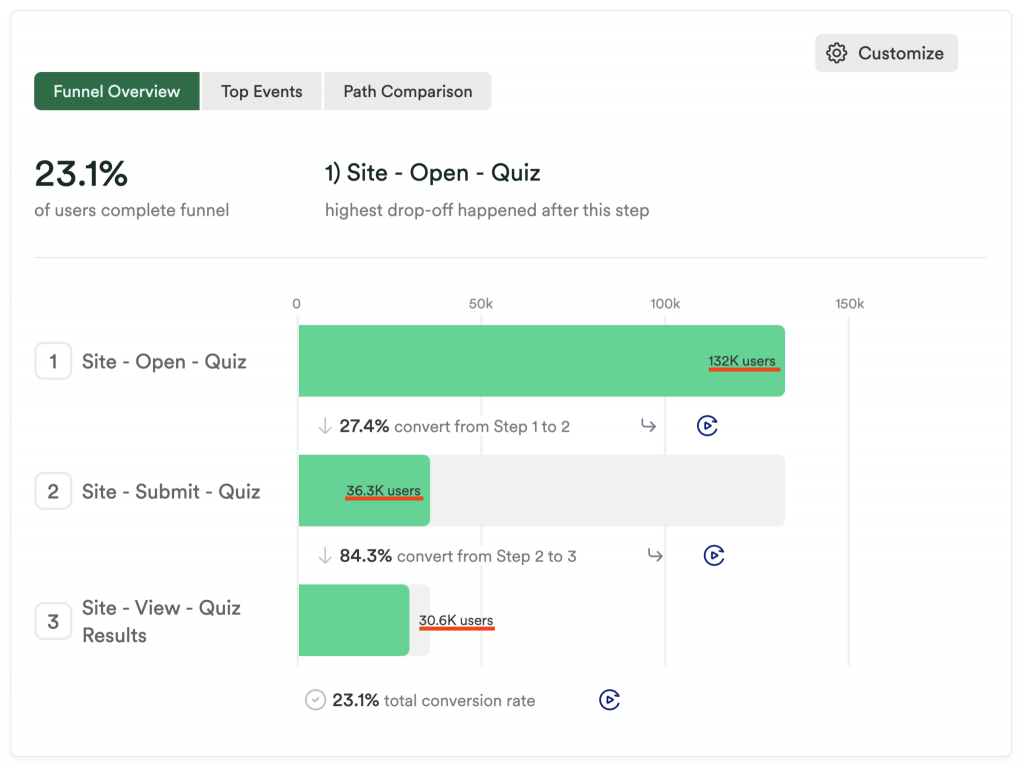
Conversion Funnel Analysis
Conversion funnel analysis tracks a customer’s journey from the initial point of contact to the final conversion point.
It tracks user behavior through each stage of this journey to identify where potential customers drop off and why they might not complete a purchase.
Heap: Automatically captures all user interactions enabling detailed funnel analysis without predefined events.
Mixpanel: Allows deep analysis of conversion funnels to identify drop-off points and optimize user flows.
Benefits of Conversion Funnel Analysis
- Identify Drop-Off Points: Helps you see where and why customers are leaving, so you can make changes to keep them engaged.
- Improve Conversion Rates: By understanding and fixing issues in the funnel, you can convert more visitors into paying customers.
- Align Marketing and Product Efforts: Analyzing the funnel shows you which marketing strategies work best and where the product might need improvement, helping your teams work together more effectively.
- Enhanced Customer Insights: Provides a deeper understanding of how customers interact with your product, which can inform future product and marketing strategies.
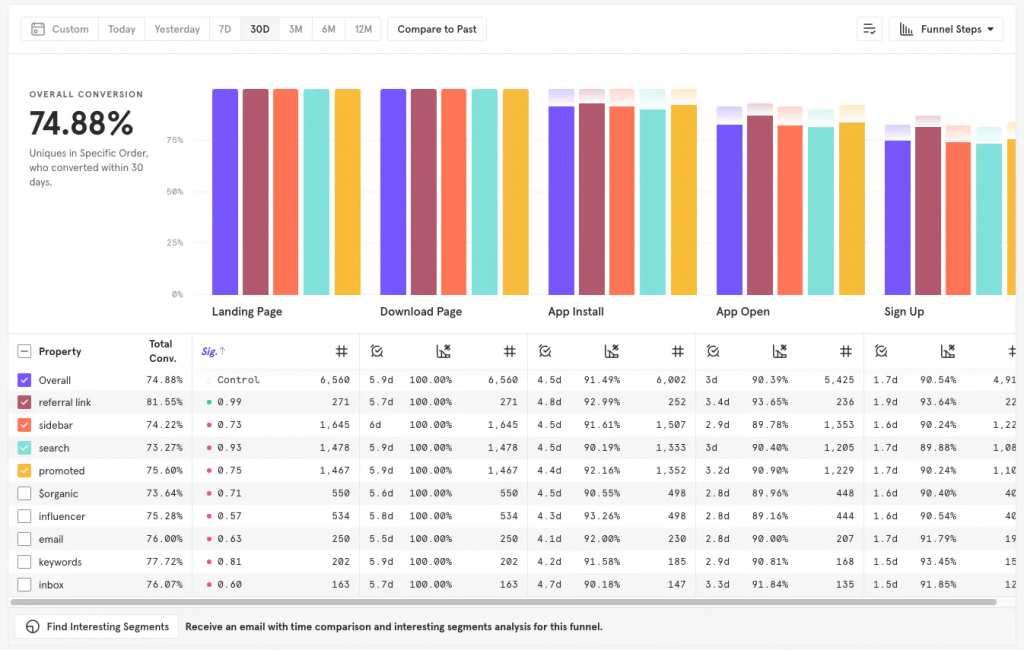
How to do Conversion Funnel Analysis?
- Define the Customer Journey: Map out the key stages from initial awareness to purchase. Include all major touchpoints like sign-ups, feature interactions, and checkouts.
- Track Conversion Events: Set up tracking for key actions customers take along the journey, such as signing up for a trial or adding items to a cart.
- Use Analytical Tools: Employ tools like heatmaps and session recordings to see how users interact with your website or app. This helps identify what draws their attention and where they face issues.
- Segment Your Users: Break down data by different user characteristics (like new vs. returning visitors) to understand various behaviors and tailor strategies accordingly.
- Analyze and Optimize: Use the data to find out where users drop off. Test changes (like simplifying the checkout process) and measure how they affect user behavior to continuously refine your approach.
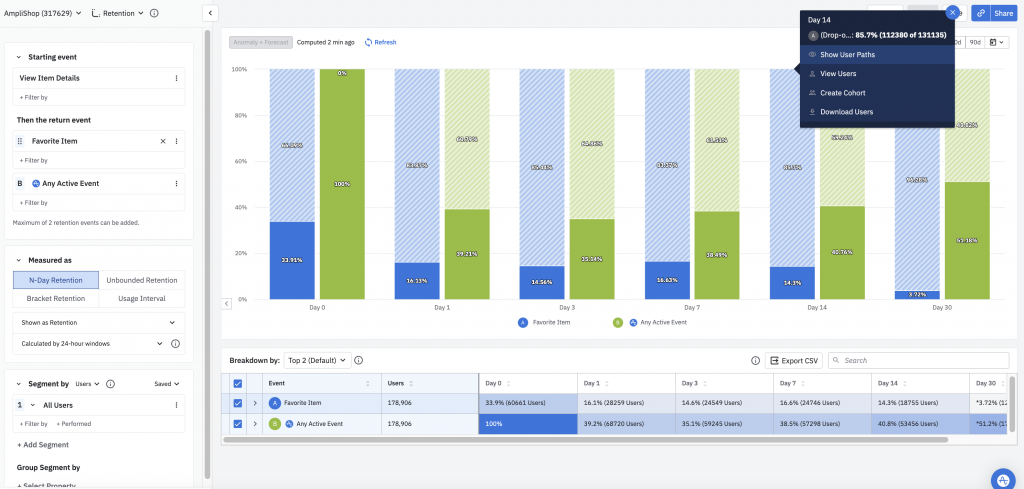
Retention Analysis
Retention analysis, also known as survival analysis, is like investigating why some customers stop using a product or service.
By looking at data about how long customers stay and why they might leave, we can figure out how to keep them happy and interested. This helps us keep a strong group of customers and find new ones, which is really important for keeping a business successful.
MoEngage and CleverTap: Analyzes user retention and churn, providing insights to tailor retention strategies.
Amplitude: Offers cohort analysis and retention tracking, highlighting factors that influence user retention.
Benefits of Retention Analysis
- Understanding Customer Behavior: Retention analysis helps you understand why customers stop using your product or service, allowing you to identify patterns and reasons for customer churn.
- Improving Customer Retention: By understanding why customers leave, you can implement strategies to improve retention rates, keeping more customers engaged with your product or service for longer periods.
- Increasing Customer Lifetime Value: By retaining customers for longer periods, you can increase their lifetime value to your business, as they continue to make purchases or use your services over time.
How to do Retention Analysis?
- Calculate Your Retention Rate: Look back at how many customers you had, and figure out how many of them are still using your product. This helps you understand how many customers you’re keeping over time.
- Choose Important Measures: Define the metrics that matter most to your business, such as customer lifetime value, churn rate, customer engagement score, Net Promoter Score, and Monthly Recurring Revenue (MRR) churn rate.
- Focus on the Right Customers: Divide your customers into different segments based on factors like usage frequency, spending habits, or demographics. This allows you to tailor your retention efforts to specific customer groups
- Spot Churn Risks: Look for signs that a customer might stop using your product. This could include things like not using certain features or not logging in for a while.
- Predict Churn Triggers: Use data to try to predict when a customer might stop using your product. This helps you take action to keep them before they leave.
- Ask Customers for Feedback: Talk to your customers to find out what they like and don’t like about your product. This helps you understand how to make your product better and keep more customers happy.
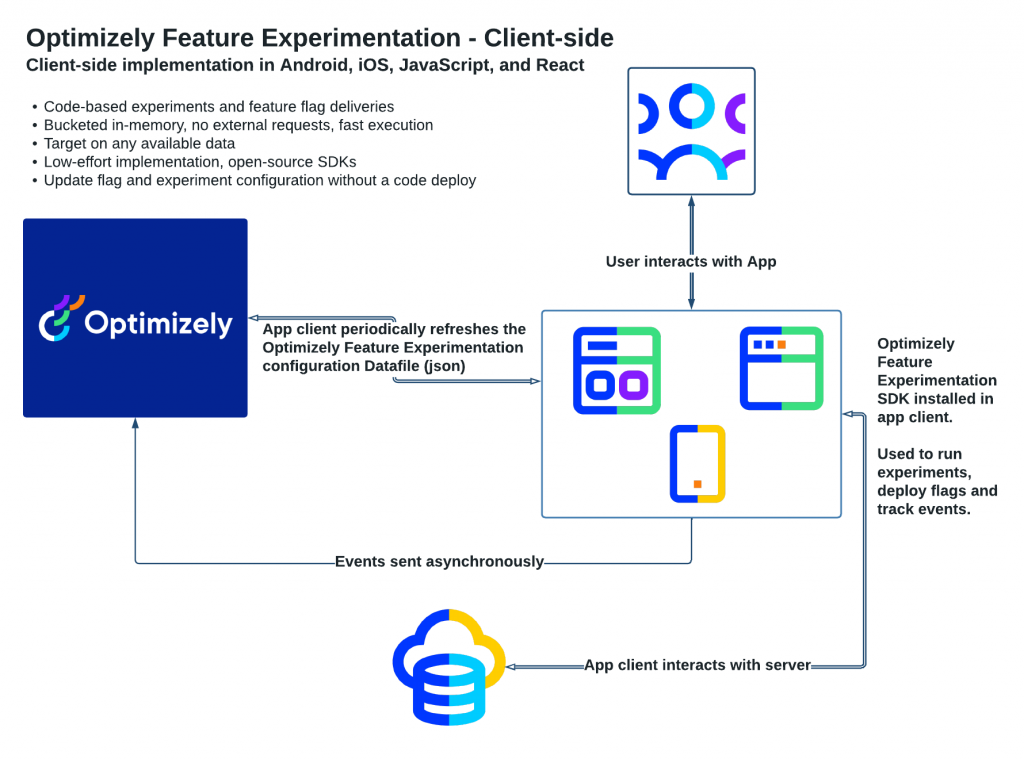
Feature Testing
Feature testing in Product Analytics involves systematically evaluating new features or changes to existing features within a product to determine their impact on user behavior and overall product performance.
Optimizely: Facilitates A/B testing and multivariate testing to evaluate different feature versions.
Unbounce: Primarily for landing pages but useful in testing variations to optimize for user satisfaction.
Benefits of Feature Testing
- Data-Driven Decision Making: Feature testing provides objective data on how users interact with new features, enabling product teams to make informed decisions based on user behavior rather than assumptions.
- Improved User Experience: By testing new features before full implementation, product teams can identify and address any issues or concerns early, resulting in a better user experience.
- Optimized Product Performance: Feature testing allows product teams to prioritize and focus on implementing features that have the greatest positive impact on user engagement, retention, and overall product performance.
- Reduced Risk: Testing features before full deployment reduces the risk of negative user reactions or unintended consequences that could harm the product or brand reputation.
How to do Feature Testing?
- Define Clear Objectives: Clearly define the goals and objectives of the feature test. What specific metrics or key performance indicators (KPIs) are you hoping to improve with the new feature?
- Hypothesize the Impact: Formulate hypotheses about how the new feature will impact user behavior and product performance. What do you expect to happen as a result of implementing the feature?
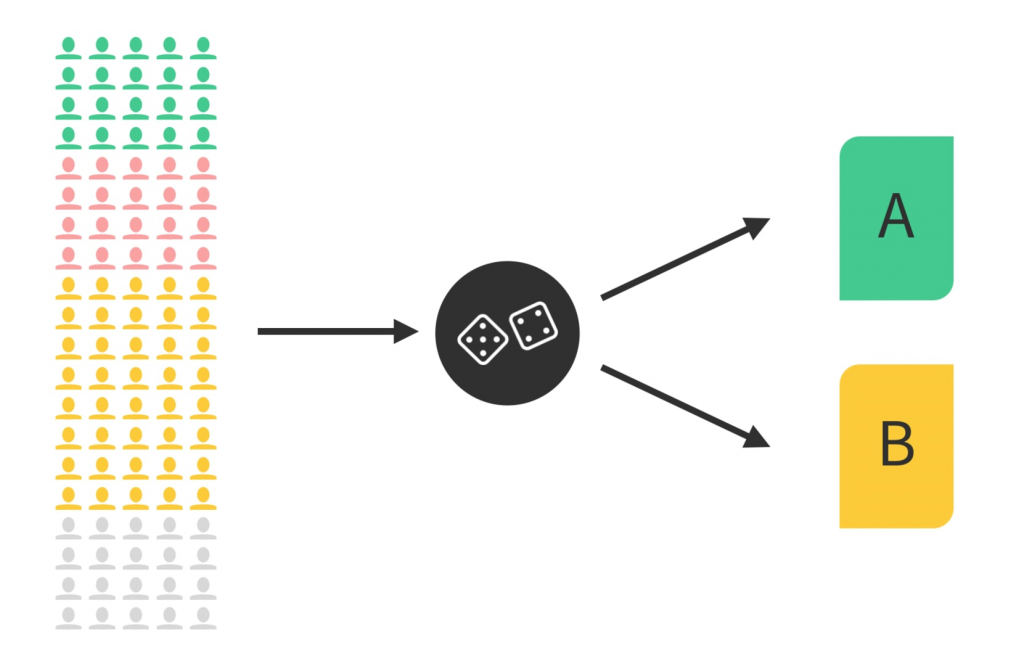
- Design the Test: Determine how you will test the new feature. This may involve A/B testing, where you compare the performance of the new feature (Variant A) to the existing feature (Variant B) with a subset of users.
- Collect Data: Implement the feature test and collect relevant data on user behavior, engagement, and other performance metrics.
- Analyze Results: Analyze the data collected during the feature test to determine the impact of the new feature on user behavior and product performance. Did the new feature achieve the desired objectives?
- Iterate and Optimize: Based on the results of the feature test, iterate on the feature design and implementation to further optimize its performance. This may involve making adjustments based on user feedback or additional testing.
Predictive Analytics
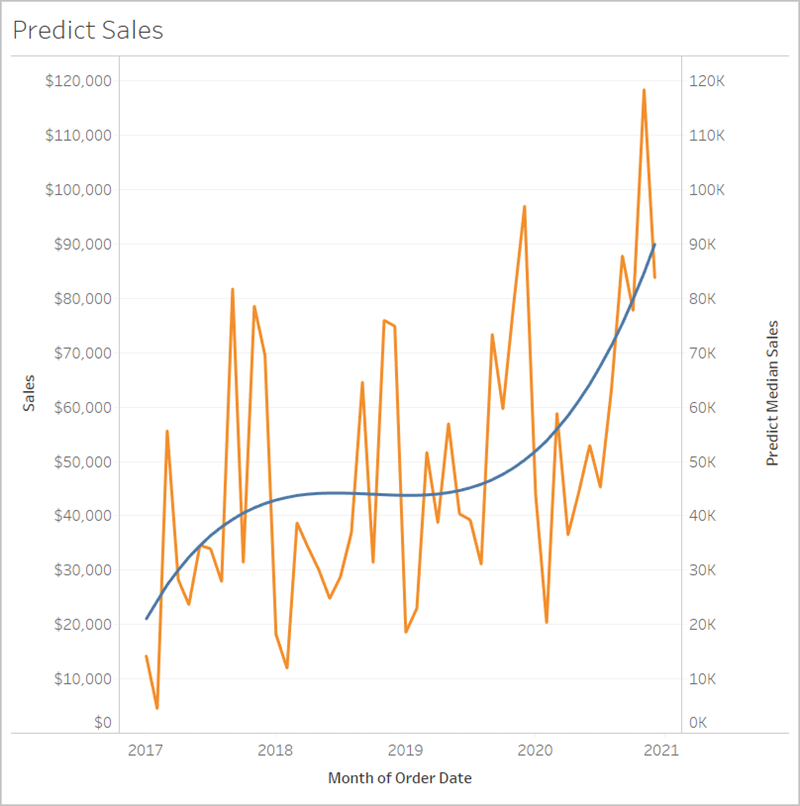
Predictive analysis in product analytics involves using historical data to make predictions about future user behaviour and product performance.
Adobe Analytics: Automates the creation of predictive models to forecast user behaviours.
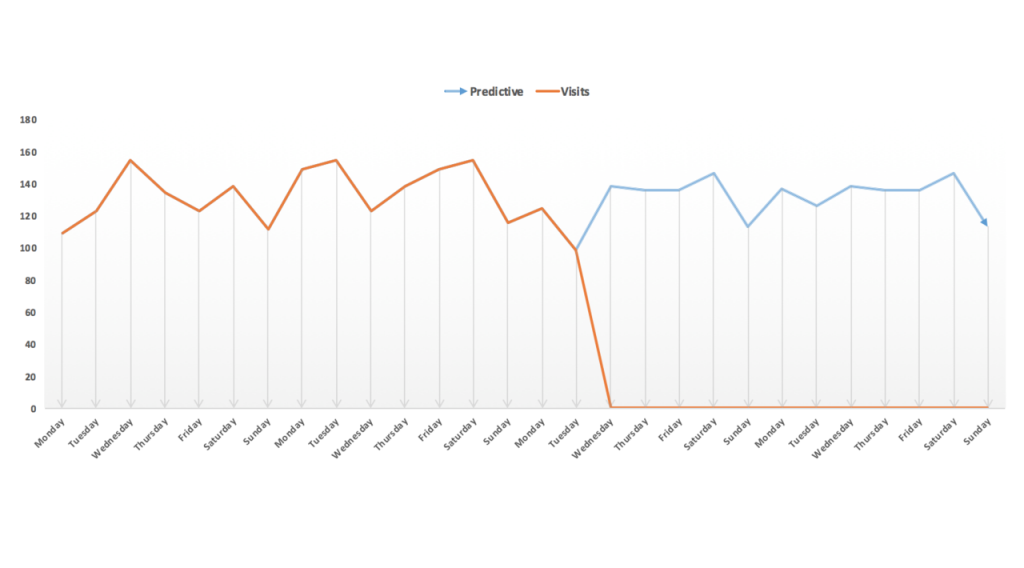
Tableau: Integrates machine learning capabilities to predict future trends based on existing user data.
Benefits of Predictive Analytics
- Anticipating User Needs: Predictive analysis helps product teams anticipate user needs and preferences, allowing them to proactively address issues and optimize user experience.
- Optimizing Product Features: By predicting how users will interact with new features, product teams can prioritize development efforts and focus on features that are likely to have the greatest impact.
- Reducing Churn: Predictive analysis can identify users who are at risk of churning, allowing product teams to implement targeted retention strategies to keep them engaged.
- Increasing Revenue: By understanding user behavior and preferences, product teams can identify opportunities to upsell or cross-sell products, increasing revenue and customer lifetime value.
How to do Predictive Analysis?
- Collect Data: Gather historical data on user behavior, including interactions with the product, purchase history, and demographic information.
- Define Predictive Variables: Identify the variables that you want to predict, such as user churn, future purchases, or product engagement.
- Choose a Predictive Model: Select a predictive model, such as regression analysis or machine learning algorithms, that is appropriate for the type of data you are working with and the predictions you want to make.
- Train the Model: Train the predictive model using historical data, making sure to split the data into training and testing sets to evaluate the model’s performance.
- Validate the Model: Evaluate the performance of the predictive model using the testing data set to ensure that it accurately predicts the desired outcomes.
- Make Predictions: Once the model has been validated, use it to make predictions about future user behavior and product performance.
Conclusion and Final Thoughts
Product analytics is about using data from user interactions with a product to drive product development, optimization, and business strategies.
It involves analyzing user behavior, segmenting users, tracking conversion funnels, and predicting future user behavior. By understanding user interactions, businesses can improve product experiences, make data-driven decisions, and enhance user retention and conversion rates.
With the right tools and methodologies, product analytics empowers businesses to optimise their products and drive growth effectively.
Here are some additional resources that might help:
- The ultimate list of resources for your next Product Management Interview
- Technology for Product Managers
- SQL for product managers – the definitive guide
- How do you think you could build a strong Product Manager Resume?