Have you ever stared at your website’s analytics, wondering why more visitors aren’t clicking that “Sign Up” button or completing a purchase? You have a hunch that changing the button’s color from blue to green might do the trick, but a hunch isn’t a strategy. How can you replace guesswork with certainty and make changes that demonstrably improve your results? This is where A/B testing comes in, transforming your marketing from an art of persuasion into a science of optimization.
This comprehensive guide will walk you through everything you need to know about A/B testing. We’ll start with the basics, explore its history, and provide a detailed, step-by-step framework you can implement immediately. By the end, you’ll understand how to run effective tests, analyze the results with confidence, and use data—not just intuition—to drive meaningful growth.
A/B testing (also known as split testing) is a method of comparing two versions of a single variable: typically a webpage or app screen to determine which one performs better. In its simplest form, you show two variants of the same page to different segments of your audience at the same time. You then collect data on which version better achieves a specific goal, such as driving more sign-ups, sales, or clicks.
By measuring how users engage with each version, you can make data-backed decisions about which changes to implement permanently. It’s a powerful way to understand user behaviour and systematically improve your key performance indicators (KPIs).
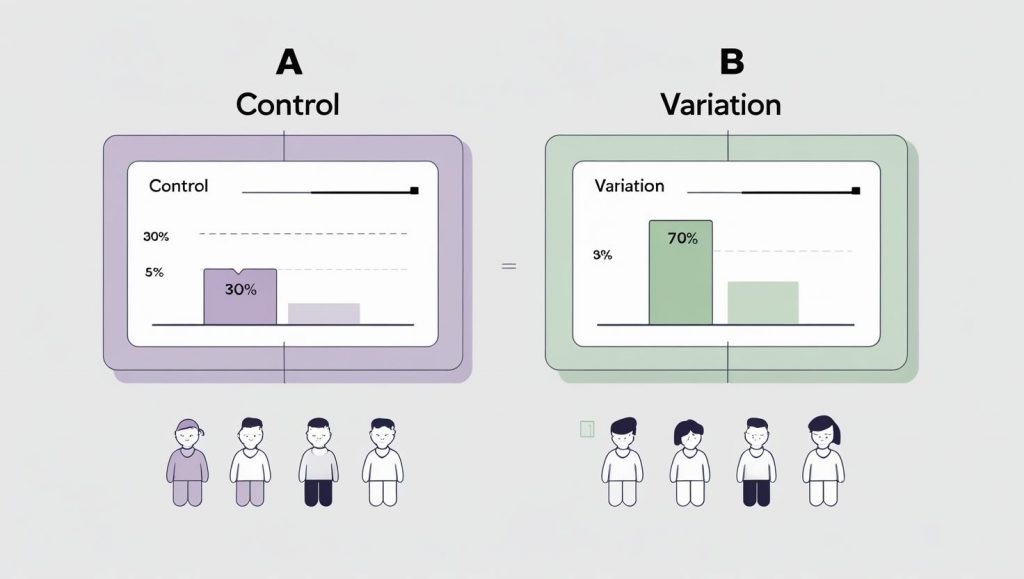
The Core Principles: Control vs. Variation
At the heart of every A/B test are two key elements:
- The ‘Control’ (Version A): This is your original, unchanged webpage or element. It acts as the baseline for performance.
- The ‘Variation’ (Version B): This is the new version you are testing, where you have changed a single element based on a hypothesis.
The version that moves your business metrics in the positive direction is declared the ‘winner.’ Implementing the changes from this winner is how you optimize your site and increase business ROI.
This entire process is a core component of a larger strategy known as Conversion Rate Optimization (CRO). It allows you to move beyond guesswork and use real user data to make impactful decisions.
A Simple Example in Action: The E-commerce Button Test
To make this crystal clear, let’s look at a practical scenario.
Imagine you run an online store. Your goal is to get more visitors to click the “Add to Cart” button on your product pages.
- The Problem: You notice that many people visit the page but don’t add the product to their cart.
- The Hypothesis: “By changing the button color from a standard blue to a more vibrant orange, we will increase clicks because the button will be more noticeable and create a sense of urgency.”
Here’s how you’d set up the A/B test:
- Version A (Control): The existing page with the blue “Add to Cart” button.
- Version B (Variation): An identical page, but the “Add to Cart” button is orange.
The Test: Using an A/B testing tool, you split your website traffic evenly. For a week, 10,000 visitors see Version A, and another 10,000 visitors see Version B.
The Result:
- Version A (Blue Button): 1,000 people clicked “Add to Cart.” (10% conversion rate)
- Version B (Orange Button): 1,250 people clicked “Add to Cart.” (12.5% conversion rate)
The Conclusion: The orange button (Version B) is the statistically significant winner. It resulted in a 25% increase in clicks. Based on this data, you would confidently implement the orange button for 100% of your visitors, knowing it will improve your store’s performance.
Why Should You A/B Test? The Core Benefits
Implementing changes based on a gut feeling is risky and expensive. A/B testing provides a scientific framework to mitigate that risk and drive real results. Here’s why it’s essential for any product manager, marketer, or designer.
- Increase Conversion Rates: This is the most celebrated benefit. By testing elements like your call-to-action (CTA) text, page layout, or pricing, you can identify changes that lead to significant lifts in sales, sign-ups, and leads.
- Improve User Engagement: Find out what truly resonates with your audience. Testing different headlines, content formats, and navigation options helps you create a more intuitive and engaging experience, keeping users on your site longer.
- Reduce Bounce Rate: A high bounce rate often signals a poor user experience or a mismatch in expectations. A/B testing helps you identify and fix points of friction, ensuring visitors find what they’re looking for and continue to explore your site.
- Make Low-Risk Modifications: Instead of overhauling your entire website and hoping for the best, A/B testing allows you to validate changes on a small segment of your audience first. This minimizes the risk of a negative change impacting all your users.
- Get Better ROI From Your Existing Traffic: The cost of acquiring traffic is high. A/B testing helps you make the most of the visitors you already have, increasing the conversion value of every user without spending more on advertising.
Who Uses A/B Testing?
- Marketers: To optimize landing pages, email campaigns (subject lines, content), and ad copy for higher click-through and conversion rates.
- Product Managers: To test new features, user onboarding flows, and pricing models to improve user adoption and retention.
- UX/UI Designers: To validate design choices, from button colors and typography to entire page layouts, ensuring a more intuitive user interface.
- E-commerce Managers: To increase average order value and checkout completion rates by testing product descriptions, images, and checkout processes.
Common Elements to A/B Test
Nearly any element on your website or in your app that affects user behavior can be A/B tested. While you can test radical redesigns, the most effective tests are often focused on specific elements tied to a clear hypothesis. Here are some of the most impactful areas to test:
- Headlines and Subheadings: Does a benefit-oriented headline (“Get More Done in Less Time”) outperform a feature-oriented one (“Our New Task Management System”)?
- Call-to-Action (CTA) Buttons: Test the text (“Get Started for Free” vs. “Sign Up”), color (green vs. orange), and placement (top of page vs. bottom).
- Images and Videos: Does a product video lead to more conversions than a static image? Does showing a picture of a person increase trust?
- Body Copy and Product Descriptions: Test the tone (professional vs. casual), formatting (paragraphs vs. bullet points), and length of your text.
- Layout and UI: Does a single-column layout work better on mobile than a multi-column one? Should your navigation be simplified?
- Forms: Test the number of fields, the labels, and the layout to reduce friction and increase submissions.
- Email Subject Lines: For email campaigns, testing your subject line is the single best way to improve open rates.
Your Step by Step Guide to Running a Successful A/B Test
Ready to run your first test? Following a structured process is key to getting reliable results. Here’s a step-by-step guide to take you from idea to implementation.
Step 1: Research and Identify the Problem
Before you start testing random ideas, you need to know what to test and why. Use data to find low-performing pages or elements on your site.
- Analytics Tools (e.g., Google Analytics): Look for pages with high traffic but low conversion rates or high bounce rates. These are prime candidates for optimization.
- Heatmaps and Session Recordings: Tools like Hotjar or Crazy Egg show you where users are clicking, scrolling, and getting stuck. This can reveal user friction points you weren’t aware of.
- User Feedback: Surveys and customer support tickets can provide direct insight into what confuses or frustrates your users.
Let’s say your research shows that your “Request a Demo” landing page has a high bounce rate. That’s your problem area.
Step 2: Formulate a Hypothesis
A hypothesis is a clear, testable statement that predicts the outcome of your test. It should include the change you’re making, the result you expect, and the reason you expect it.
A good hypothesis format is: “By changing [Independent Variable] into [Variation], we will [Predicted Outcome] because [Rationale].”
- Example Hypothesis: “By changing the call-to-action button text from ‘Submit’ to ‘Get Your Free Demo,’ we will increase form submissions because the new text is more specific and highlights the value for the user.”
Step 3: Create Your Variation
Now, create the “B” version based on your hypothesis. Using our example, you’d duplicate your existing landing page and change only the button text to “Get Your Free Demo.”
Crucial Rule: Only change one element at a time. If you change the headline, the button text, and the main image all at once, you won’t know which change was responsible for the lift (or drop) in conversions.
Step 4: Run the Test
Use an A/B testing tool (like Google Optimize, Optimizely, or VWO) to run your experiment. The tool will automatically split your traffic between the control (A) and the variation (B) and track the results.
Before you launch, determine two key parameters:
- Sample Size: How many users need to see your test to get a reliable result? Most tools have built-in calculators for this.
- Test Duration: Let the test run long enough to account for fluctuations in user behavior (e.g., weekday vs. weekend traffic). A common recommendation is to run it for at least one to two full business cycles (e.g., two weeks).
Warning: Don’t stop the test the moment you see one version pulling ahead! This is a common mistake called “peeking” and can lead to false positives. Wait for the test to reach statistical significance.
Step 5: Analyze the Results
Once your test has concluded, it’s time to analyze the data. Your A/B testing tool will present the results, but you need to look at three key metrics:
- Conversion Rate: The percentage of users who completed the desired action on each version.
- Confidence Level (or Statistical Significance): This tells you how likely it is that the results are due to your changes and not just random chance. The industry standard is a 95% confidence level. If your tool reports a 95% chance to beat the original, you have a winner.
- P-value: This is another statistical measure. A p-value of p≤0.05 is generally considered statistically significant, meaning there’s a 5% or lower probability that the results are random.
If your variation won with statistical significance, great! If not, the test is inconclusive, which is also a valuable learning experience.
Step 6: Implement the Winner and Repeat
If your variation (B) produced a statistically significant win, implement the change for 100% of your audience. If it lost or was inconclusive, stick with your control (A).
The most important part of this step is to document your learnings and repeat the process. A/B testing isn’t a one-and-done activity. It’s a continuous cycle of improvement. Take what you learned from this test and form a new hypothesis to test next.
Real World Examples of A/B Testing in Action
Let’s look at a few examples of how A/B testing can be used to drive real results.
- The E-commerce Checkout Flow: An online retailer wants to reduce cart abandonment. They hypothesize that a single page checkout process will be less intimidating for users than their current multi page process. They run an A/B test and find that the single page checkout increases completed purchases by 15%.
- The SaaS Onboarding Experience: A software as a service company wants to improve user activation. They test two versions of their onboarding flow. Version A is a self guided tour, while Version B is a series of interactive tutorials. They find that Version B leads to a 25% increase in users completing the key activation steps.
- The Media Website’s Homepage: A news website wants to increase the time users spend on their site. They test two different homepage layouts. Version A has a traditional grid of articles, while Version B has a more personalized, feed style layout. The A/B test reveals that Version B increases the average session duration by 40%.
From Pro to Master: Advanced A/B Testing Concepts
Once you’ve mastered the basics, you can start to explore more advanced testing strategies.
- Multivariate Testing: This is like an A/B test on steroids. Instead of testing one change, you can test multiple changes at once to see which combination performs the best. For example, you could test two different headlines, two different images, and two different calls to action all in the same test.
- A/B/n Testing: This is when you test more than two versions at once. For example, you might have a control and three different variations. This is useful when you have multiple ideas and want to test them all at the same time.
- Sequential Testing: This is an approach that allows you to stop a test as soon as a statistically significant result is reached, which can save you time and resources.
Common A/B Testing Mistakes to Avoid
Running a test is easy. Running a good test is hard. Here are some common pitfalls to watch out for:
- Testing Too Many Elements at Once: As mentioned, this is technically multivariate testing. If you’re a beginner, stick to changing one element at a time to get clear, actionable results.
- Not Letting the Test Run Long Enough: Ending a test prematurely because you’re excited about early results is a huge mistake. Random variance can make one version look like a winner in the first few days. Wait for the pre-determined sample size or duration.
- Ignoring Statistical Significance: A 5% lift in conversions means nothing if the confidence level is only 60%. Don’t act on results that aren’t statistically significant.
- Testing Trivial Changes: While testing button colors is a classic example, don’t expect it to double your revenue. Focus on changes tied to your hypothesis that impact user motivation and value proposition, such as headlines, offers, and calls-to-action.
- Giving Up After a Failed Test: A test that doesn’t produce a winner isn’t a failure. It’s a learning opportunity. It tells you that your hypothesis was incorrect, which is valuable information that prevents you from making a bad change.
Final Thoughts: Why A/B Testing Belongs in Every PM’s Toolkit
A/B testing is more than just a process; it’s a mindset. It’s about being curious, being data driven, and being willing to be wrong. It’s about building a culture of experimentation where every idea, no matter how big or small, can be tested and validated.
As a product manager, you are the champion of the user. A/B testing is your most powerful tool for understanding their needs and building products that they will love. So, the1 next time you find yourself in a debate about what to build next, don’t just argue. Test it. Let your users show you the way.
FAQs
Don’t focus on a set number of days. Run the test until your tool tells you the result is trustworthy (this is called “statistical significance”). It’s also smart to run it for at least one full week to include both weekday and weekend user behaviour.
This is a good result! It means your change didn’t make a real difference. This saves you time and effort building something that doesn’t actually help users. Now you can try a new, better idea.
Yes, you can test many different versions at the same time. This is helpful when you have a few good ideas to compare. Just know that more versions need more website visitors and more time to find a clear winner.
There are many easy to use tools. Popular ones include Optimizely, VWO, and Amplitude. They help you set up tests and understand the results. Most offer free trials so you can see which one works best for you.
Imagine an app has a green “Sign Up” button. To see if a different color works better, they create a second version of the screen with a blue button. They show the green button to half their users (A) and the blue button to the other half (B). They then measure which color gets more sign ups.
A basic A/B test compares two versions of a page to see which one performs better. You take your original page (Version A) and a new page with one single change (Version B). You show both to users, and the one that gets more clicks or conversions is the winner.
There are a few major types:
1. A/B Test: Compares one version against another.
2. A/B/n Test: Compares three or more versions at once.
3. Split URL Test: Tests two completely different web pages against each other.
4. Multivariate Test (MVT): Tests changes to multiple elements at the same time to find the best combination.
You validate a test by letting it run until it reaches Statistical Significance (usually 95% or higher). This is a number provided by your testing tool that proves your result is trustworthy and not just due to random chance. You should not declare a winner until you reach this number.
Learn better with active recall quiz
How well do you know What is A/B Testing? A Step-by-Step Guide for Product Managers Let’s find out with this quick quiz! (just 10 questions)